Release date: January 18, 2022
DOI: https://doi.org/10.25318/36280001202101200004-eng
Skip to text
Text begins
Abstract
This paper provides a sociodemographic profile of business
owners with disabilities using 2017 administrative tax data. It evaluates how
sociodemographic characteristics of business owners with disabilities intersect
and compares them with those of business owners without disabilities. It also
examines the firm-level measures of these businesses, including firm size,
industry, exports and financial characteristics.
Authors
Amélie Lafrance-Cooke and Robby Bemrose are with the
Economic Analysis Division at Statistics Canada.
Acknowledgements
This study was funded by Women and Gender Equality Canada.
The authors would like to thank Danny Leung, Lyming Huang, April Doreleyers,
Marysa Vachon, Julie Burns, Nicole Yaansah, Sarah Jane Ferguson, Patrice
Rivard, Winnie Chan and Haleigh Prevost for their helpful comments.
Introduction
According to the 2017 Canadian Survey on Disability (CSD),
approximately 3.7 million Canadians aged 25 to 64 have a disability and,
as a result, are limited in their daily activities (Morris et al. 2018). While
about 65% of these working-age Canadians were also in the labour force, they
are disproportionately underrepresented in the labour force compared with persons
without disabilities (i.e., 85% of persons without disabilities are in the
labour force). Previous research has shown that persons with disabilities face
challenges and barriers in the labour market that can negatively impact their
earnings (Jones 2011; Lechner and Vazquez-Alvarez 20103 and increase their
likelihood of being in low-income groups (Wall 2017). The COVID-19 pandemic
further highlighted the vulnerability of this population, particularly in terms
of unique challenges that they may face, which intensified over the pandemic. These
include reliance on help outside the household for daily activities and the
likelihood of not having Internet access,Note which became an important asset to connect with others virtually and purchase
goods online.
A potential solution to low labour force participation
rates for persons with disabilities is self-employment or owning a business
(Kitching 2014). Entrepreneurship can offer an entry into the labour market,
which, in turn, can lead to improved income. It can provide more flexibility in
the pace of work and, potentially, a greater ability to work from home
(Kitching 2014).
According to the 2017 CSD, 8.6% of persons with
disabilities were self-employed in 2016, compared with 11.1% of persons without
disabilities. This contrasts slightly with evidence in the United States and in
Europe, where higher self-employment rates were found among persons with
disabilities (Kitching 2014). Nevertheless, such studies have found that
persons with disabilities face specific barriers to entrepreneurship, including
difficulties accessing capital and lack of appropriate and sensitive business
support or advice (Boylan and Burchardt 2002). New businesses created by
entrepreneurs with disabilities are less likely to become viable businessesNote (Renko, Harris and
Caldwell 2015).
There have been few Canadian studies on business owners
with disabilities, most likely because of the lack of available data on this
group of individuals. The Survey on Financing and Growth of Small and Medium
Enterprises (SFGSME) collects information on small and medium-sized enterprises
that are majority-owned by persons with disabilities, but this survey is
infrequent (i.e., every three years) and is limited in scope (e.g., there are
limits to intersectional analysis). Nevertheless, it offers a glimpse of the
profile of businesses that are majority-owned by persons with disabilities.
Data for 2017 show that a small proportion (0.5%) of small and medium
enterprises are majority-owned by persons with disabilities (Huang 2020). The
majority of these businesses have between one and fewer than four employees,
they tend to have sales growth between 1% and 10% per year, and a minority are
exporters. In addition, the owners of businesses majority-owned by persons with
disabilities tend to be young (younger than 49 years old), and they tend to
have a postsecondary education or higher.
More recently, the quarterly Canadian Survey on Business
Conditions has been collecting information to measure the impact of COVID-19 on
businesses, including businesses majority-owned by persons with disabilities.
While the survey cannot be used to examine the characteristics of businesses
majority-owned by persons with disabilities before the pandemic, it continues
to be an important contributor to the understanding of the effects of the
pandemic on diverse groups of businesses. Results from the first survey
undertaken in April 2020 suggest that businesses majority-owned by a person
with disabilities may have been more negatively impacted. For instance, 4.7% of
such businesses closed permanently, compared with 1.0% of businesses on
average. About one-half of businesses majority-owned by a person with
disabilities experienced a drop in revenue of more than 40% in early 2020
compared with the same period in 2019, relative to one-third of businesses on
average.
The lack of recurring and comprehensive data on business
ownership among persons with disabilities presents challenges in providing a
full picture of this group, which, in turn, is needed to design policies to
address barriers to business ownership. This paper attempts to fill this gap by
providing a sociodemographic profile of business owners with disabilities using
2017 administrative tax data. It evaluates how sociodemographic characteristics
of business owners with disabilities intersect and compares them with those of business
owners without disabilities. It also examines the firm-level measures of these
businesses. To the best of the authors’ knowledge, the administrative data have never been used for
this type of study in Canada.
Data and methods
The data used to generate the sociodemographic
characteristics of business owners with disabilities and the firm-level
measures of the businesses they own are from the Canadian Employer–Employee
Dynamics Database (CEEDD). This linkable employer–employee dataset is based on
processed administrative data sources from Statistics Canada; the Canada
Revenue Agency (CRA); Employment and Social Development Canada; and Immigration,
Refugees and Citizenship Canada (Chan, Liu and Morissette 2018). The key
variables used for this study are found in the T1 personal master file (T1PMF)
in the CEEDD, which includes information from form T2201 Disability Tax Credit
Certificate. The disability deduction claim is the variable used to identify
individuals with disabilities.Note
There were four main data processing steps in the
methodology. The first step entailed identifying persons with disabilities
within the population of individual tax filers, together with extracting the
associated sociodemographic and geographic variables. The second step involved
aggregating the individual ownership shares for a business from the reporting
units in the tax files to statistical units that correspond with the data
collected at the firm level (i.e., enterprise). The third step consisted of
linking the individuals with disabilities, along with their demographic
variables, to the shareholders of the private enterprises they own and
acquiring the associated firm-level measures. The fourth step involved deriving
the ownership share of each enterprise by gender, immigrant status and
disability status. Two approaches were used to identify the businesses owned by
persons with disabilities, as follows: (1) the business has one or more owners who
claim the disability tax credit (DTC), and (2) the business ownership share is
greater than or equal to 51% for owners who claim the DTC. The subsequent
sections describe the details of these processing steps.
Individual-level tax files
Persons with disabilities were identified in the
individual-level T1PMF data file (General Income Tax and Benefit Return) if
there was a claim made for either the DTC or the attendant care expenses
deduction in the 2017 tax year, both of which are discussed in more detail in
the next section. The T1PMF sociodemographic variables for this study are
largely limited to age, gender and income. The geographic variable, province or
territory of residence in the T1PMF, was also included. To obtain information
on the immigrant status, the CEEDD Longitudinal Immigration Database (IMDB)
file was linked to the T1PMF. The IMDB file contains immigration-related
information for foreign-born individuals who have become landed immigrants in
Canada since 1980 (Chan, Liu and Morissette 2018).
Enterprise-level ownership share
The business ownership share for incorporated businesses is
found in the CEEDD T2 Corporation Tax Return, Schedule 50 Shareholder
Information (T2S50) and for unincorporated businesses in the CEEDD T1 Financial
Declaration and Business Declaration (T1FDBD). The pre-processing steps applied
to generate the ownership share in these files can be found in a paper by Grekou,
Li and Liu (2018). With the shareholder data, the main objective is to
aggregate the percentage ownership shares to the enterprise-level statistical
unit. For the incorporated businesses, this is done by linking the T2S50 by the
Business Number (BN) to the National Accounts Longitudinal Microdata File
(NALMF). The NALMF is an enterprise-level database that includes all
enterprises that filed a Corporation Income Tax Return (T2), Statement of Remuneration
Paid (T4 slip) or payroll statement of account for source deductions (PD7)
(Grekou, Gu and Yan 2020). The NALMF provides the structure to link reporting
units in the administrative data (i.e., BN) to institutional units (i.e., enterprise).
Following the approach presented by Grekou, Li and Liu (2018), when the
enterprise consists of more than one BN, the ownership share is adjusted by
multiplying the individual ownership shares by the quotient of assets reported
at the BN and enterprise level. If the enterprise has only one associated BN,
the ownership share at the BN level is directly assigned to the enterprise. If
assets are missing, each individual is assigned an equal ownership share of the
enterprise. A similar approach is followed for the unincorporated businesses in
the T1FDBD, using methods found in the paper by Grekou, Li and Liu (2018).
Identifying the business owners and firm-level data
The business owners are identified by linking the
individual-level tax file (T1PMF) to the ownership share files of the
incorporated (T2S50) and unincorporated (T1FDBD) businesses. There are
3,052,951 individuals (including duplicates, because an individual could own
multiple businesses) in the T2 incorporated data; 2,927,428 were found in the
T1 file (≈ 96%). There are 1,359,427 individuals in the T1 unincorporated
data; 1,350,303 were found in the T1 file (≈ 99%). Business owners could
be missing from the individual tax returns because they did not submit their
taxes or they were late filing. The information could also have been entered
incorrectly in either of the tax files.
The NALMF firm-level data are linked to the incorporated
business ownership data by enterprise identifier to obtain the number of
employees,Note North American Industry Classification System industry, capital cost allowance,
net income, total assets, research and development (R&D) spending, total
revenue, and exports for each firm. The same variables for the unincorporated businesses
are already included in the T1FDBD file.Note
Ownership share by different subgroups
The firm-level ownership share is used to calculate the
portion of ownership for each category within the gender and immigrant status
variables. The individual ownership shares of the firm are summed by the
categories to determine the percentage amount of each category within the firm.
If the share of a category is greater than or equal to 51%, the class is labelled
as majority-owned. If the share between the categories is the same, there is
equal ownership. If there is no dominant category of ownership and the
categories do not sum to 100%, the firm is labelled as missing. As described by
Grekou, Li and Liu (2018), this can occur because only the shareholders with at
least 10% of the shares of a private corporation are reported in the T2S50, and
shareholders’ information can be misfiled or missing. The intersection of these
demographic dimensions of ownership is evaluated through cross tabulations.
Disability tax credit: What is it and how well does it capture the
population of persons with disabilities?
The DTC is a non-refundable tax credit that was introduced
in 1988 to allow persons with disabilities to reduce the amount of income tax
that they may have to pay. To be eligible for the DTC, an individual must
experience difficulties performing activities of daily living, such as walking,
speaking, feeding oneself or hearing, or other debilitating conditions that
affect day-to-day living.Note An individual applying for the DTC must have a medical practitioner fill out
form T2201 Disability Tax Credit Certificate, which certifies that the
individual has a severe and prolonged disability. If the individual’s medical
condition improves, they will no longer be eligible to receive the DTC. Persons
can claim the DTC for their spouse or dependants, but this article will focus
on individual claims.
In addition to the DTC, persons with disabilities can claim
attendant care expenses. These may be fees paid for full-time care in a nursing
home or salaries and wages of an attendant providing care within a person’s
home. In most cases, the DTC and attendant care expenses cannot both be
claimed. As a result, for the purposes of this paper, the number of persons
with disabilities also includes persons claiming attendant care expenses,
consisting of about 1,000 individuals who did not claim the DTC.
In 2017, about 841,000 Canadians aged 15Note and older claimed the DTC,
representing 3.0% of the total number of individuals who completed a tax
return, and 802,000 of these claimants were aged 25 and older, which is the age
group studied in this paper. This comparesNote with the 6.2 million Canadians aged 15 and older with disabilities based
on the 2017 CSD, of whom about 2.7 million had a severe or very severe
disability, limiting their daily activities. The considerably lower number of individuals
identified in the tax data is to be expected because individuals with
disabilities might not have enough taxable income to claim the DTC or might not
be in the labour force. In addition, some persons with disabilities may not be claiming
the DTC because they thought they did not meet the criteria, they did not know
that the tax credit existed or they were not able to obtain a completed
certificate (T2201) from their doctor (Duclos and Langlois 2003).
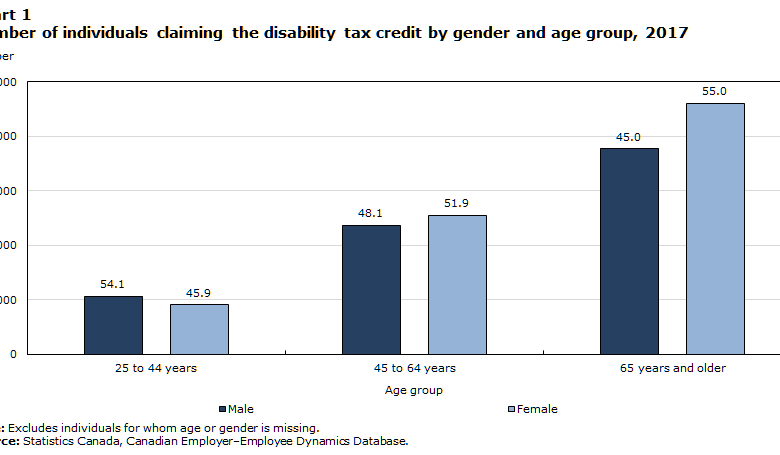
Among persons aged 25 and older, more than half (56.4%) of
individuals who claim the DTC are older than 65, 55% of whom are women (Chart
1). The share of women who claim the DTC increases with age; for persons aged
25 to 44, 54.1% of claimants are men. The gender distribution of persons
claiming the DTC is similar to the sex distribution in the CSD among
individuals aged 45 and older: 53.1% of persons with disabilities aged 45 to 64
are women, and 56.2% of persons with disabilities aged 65 and older are women.
In contrast, among the 25-to-44 age group, women represent 58.7% of persons
with disabilities based on the CSD.

Data table for Chart 1
| Age group | Male | Female | Male | Female |
|---|---|---|---|---|
| count | percent | |||
| 25 to 44 years | 53,104 | 45,144 | 54.1 | 45.9 |
| 45 to 64 years | 118,189 | 127,539 | 48.1 | 51.9 |
| 65 years and older | 188,497 | 230,000 | 45.0 | 55.0 |
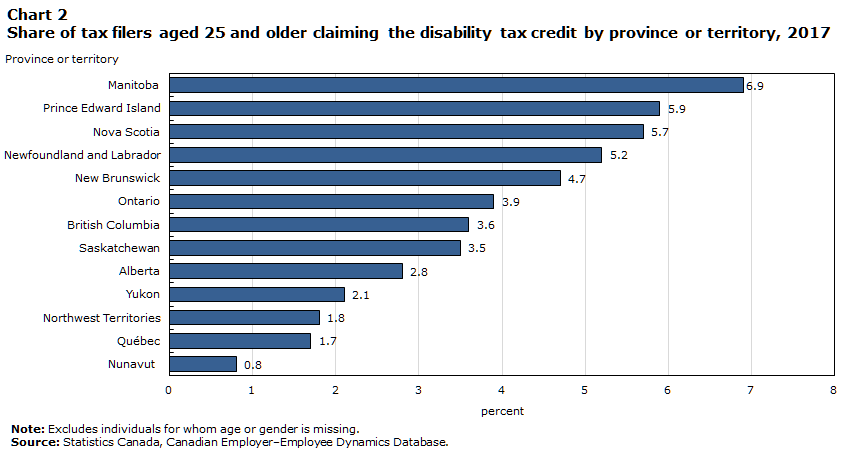
At the provincial and territorial level, a higher share of
individuals claimed the DTC in Manitoba (6.9%) and in the Atlantic provinces,
ranging from 4.7% in New Brunswick to 5.9% in Prince Edward Island (Chart 2).
Data table for Chart 2
| Province or territory | Percent |
|---|---|
| Manitoba | 6.9 |
| Prince Edward Island | 5.9 |
| Nova Scotia | 5.7 |
| Newfoundland and Labrador | 5.2 |
| New Brunswick | 4.7 |
| Ontario | 3.9 |
| British Columbia | 3.6 |
| Saskatchewan | 3.5 |
| Alberta | 2.8 |
| Yukon | 2.1 |
| Northwest Territories | 1.8 |
| Québec | 1.7 |
| Nunavut | 0.8 |
What is also noticeable from Chart 2 is the low share of
DTC claimants in Quebec compared with the other regions. Low shares of persons
with disabilities in Quebec have been presented in the literature (e.g.,
Dunstan 2003; Mackenzie 2013; Arim 2015). The low share of disability claims
could be a result of the Revenu Québec provincial disability tax credit, which
might be claimed instead of the federal DTC.
With the form T2201 Disability Tax Credit Certificate, it
is possible to determine the type and number of disabilities accepted by the
CRA for each individual who claims the tax credit, such as markedly restricted
mobility or walking, vision and speech. Nearly three-quarters (68.2%) of
individuals claiming the credit specify mobility or restricted walking as a
disability (Table 1). The second most common disability is mental functions
necessary for everyday life, which 39.1% of individuals specify on form T2201.
| Type of impairment | Number | Percentage of individuals claiming the DTCTable 1 Note 1 |
|---|---|---|
| Mobility | 573,679 | 68.20 |
| Mental function necessary for everyday life | 328,971 | 39.10 |
| Dressing | 226,398 | 26.90 |
| Eliminating | 111,436 | 13.30 |
| Feeding | 93,131 | 11.10 |
| Speech | 61,588 | 7.30 |
| Hearing | 61,487 | 7.30 |
| Life sustaining therapy | 55,635 | 6.60 |
| Vision | 53,186 | 6.30 |
| Other | 5,215 | 0.60 |
Results
Sociodemographic characteristics of business owners with disabilities
This section describes the type of disability and
sociodemographic characteristics (i.e., age, gender, immigrant status and
income) of the business owners with disabilities. Of the individuals that claim
the DTC, 1.3% (17,575) are shareholders of unincorporated businesses (T1FDBD)
and 1.2% (23,526) are shareholders of incorporated (T2S50) businesses.Note Note Results in this
section will be presented separately for the two types of businesses.
Business owners with disabilities tend to be older than business owners
without disabilities and a higher share are women
| Type of impairment | Unincorporated | Incorporated | ||
|---|---|---|---|---|
| number | percentage | number | percentage | |
| Mobility | 9,930 | 56.50 | 13,088 | 55.60 |
| Dressing | 3,589 | 20.40 | 5,026 | 21.40 |
| Mental function necessary for everyday life | 2,356 | 13.40 | 3,980 | 16.90 |
| Eliminating | 1,973 | 11.20 | 2,770 | 11.80 |
| Life sustaining therapy | 1,645 | 9.40 | 2,226 | 9.50 |
| Feeding | 1,302 | 7.40 | 1,993 | 8.50 |
| Hearing | 1,170 | 6.70 | 1,409 | 6.00 |
| Vision | 784 | 4.50 | 1,189 | 5.10 |
| Speech | 608 | 3.50 | 1,015 | 4.30 |
| Other | 14 | 0.10 | 21 | 0.10 |
The types of disability of the business owners are presented
in Table 2. The distribution of disabilities for business owners of both incorporated
and unincorporated businesses is similar. A mobility disability was reported by
more than half of business owners, as the most common disability, followed by
dressing and mental function disabilities.
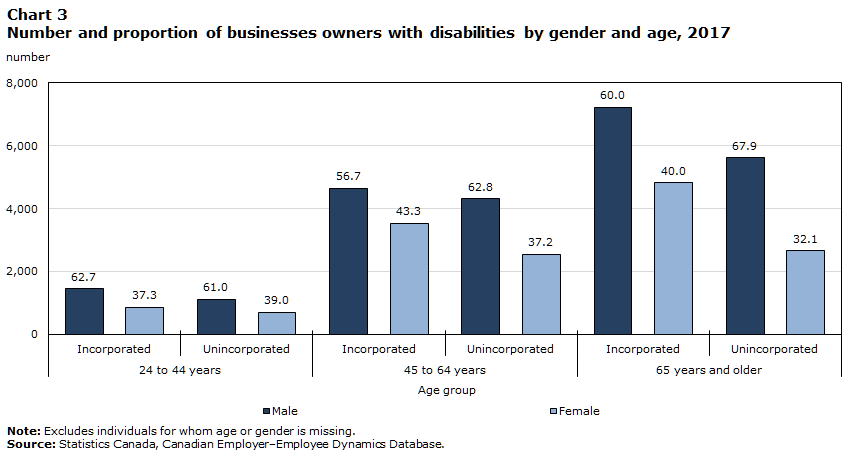
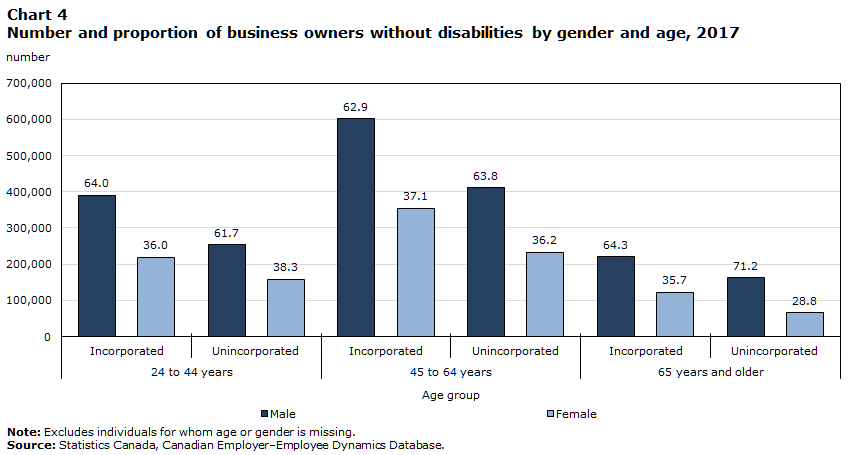
The age distribution among business owners with
disabilities (Chart 3) is noticeably different than that among business owners
without disabilities (Chart 4). The number of business owners with disabilities
increases with age for both unincorporated and incorporated businesses, with
the majority of business owners aged 65 and older (Chart 3). This is driven by
the fact that more than half of DTC claimants are aged 65 and older. In
contrast, business owners aged 45 to 64 without disabilities represent the
largest proportion of business owners (Chart 4).
There is a larger share of women with disabilities aged 45
and older who own incorporated businesses compared with unincorporated
businesses (Chart 3). In particular, 40.0% of owners of incorporated businesses
aged 65 and older who claimed the DTC are women, compared with 32.1% of owners
of unincorporated businesses. Among the 45-to-64 age category of business
owners with disabilities, 43.3% of incorporated businesses and 37.2% of
unincorporated businesses are owned by women. These two shares are higher than
what is observed for business owners without disabilities (37.1% and 36.2%)
(Chart 4). Nevertheless, while women account for a larger share of DTC
claimants among older age groups, business ownership remains male-dominated.
Data table for Chart 3
| Age group | Male | Female | Male | Female | |
|---|---|---|---|---|---|
| number | percent | ||||
| 24 to 44 years | Incorporated | 1,448 | 862 | 62.7 | 37.3 |
| Unincorporated | 1,114 | 712 | 61.0 | 39.0 | |
| 45 to 64 years | Incorporated | 4,643 | 3,539 | 56.7 | 43.3 |
| Unincorporated | 4,304 | 2,549 | 62.8 | 37.2 | |
| 65 years and older | Incorporated | 7,212 | 4,817 | 60.0 | 40.0 |
| Unincorporated | 5,609 | 2,652 | 67.9 | 32.1 | |
Data table for Chart 4
| Age group | Male | Female | Male | Female | |
|---|---|---|---|---|---|
| number | percent | ||||
| 24 to 44 years | Incorporated | 390,346 | 219,181 | 64.0 | 36.0 |
| Unincorporated | 254,250 | 158,081 | 61.7 | 38.3 | |
| 45 to 64 years | Incorporated | 601,891 | 355,163 | 62.9 | 37.1 |
| Unincorporated | 410,941 | 232,675 | 63.8 | 36.2 | |
| 65 years and older | Incorporated | 221,020 | 122,909 | 64.3 | 35.7 |
| Unincorporated | 162,356 | 65,778 | 71.2 | 28.8 | |
Immigrant business owners with disabilities are younger than non-immigrant
business owners with disabilities
Few immigrant business owners claim the DTC. For example,
among incorporated businesses, immigrant business owners represent 22.3% of
business owners who do not claim the DTC, compared with 7.6% of businesses
owners who claim the DTC (Table 3). Since similar shares of the Canadian
population of immigrants and non-immigrants have disabilities,Note the lower share of immigrants
claiming the DTC may be because of a higher proportion of immigrants,
particularly recent immigrants, who are not aware of the tax credit.
| Incorporated | Unincorporated | |||
|---|---|---|---|---|
| number | share of all incorporated (percent) | number | share of all unincorporated (percent) | |
| Business owners with disabilities | ||||
| Immigrant | ||||
| 25 to 44 years | 327 | 1.50 | 222 | 1.30 |
| 45 to 64 years | 956 | 4.20 | 771 | 4.60 |
| 65 years and older | 438 | 1.90 | 239 | 1.40 |
| 25 years and older | 1,721 | 7.60 | 1,232 | 7.30 |
| Non-immigrant | ||||
| 25 to 44 years | 1,983 | 8.80 | 1,604 | 9.50 |
| 45 to 64 years | 7,226 | 32.10 | 6,082 | 35.90 |
| 65 years and older | 11,591 | 51.50 | 8,022 | 47.40 |
| 25 years and older | 20,800 | 92.40 | 15,708 | 92.70 |
| Business owners without disabilities | ||||
| Immigrant | ||||
| 25 to 44 years | 187,605 | 9.80 | 112,807 | 8.80 |
| 45 to 64 years | 214,453 | 11.20 | 150,995 | 11.80 |
| 65 years and older | 24,895 | 1.30 | 15,309 | 1.20 |
| 25 years and older | 426,953 | 22.30 | 279,111 | 21.70 |
| Non-immigrant | ||||
| 25 to 44 years | 421,922 | 22.10 | 299,524 | 23.30 |
| 45 to 64 years | 742,601 | 38.90 | 492,621 | 38.40 |
| 65 years and older | 319,034 | 16.70 | 212,825 | 16.60 |
| 25 years and older | 1,483,557 | 77.70 | 1,004,970 | 78.30 |
Immigrant business owners who claim the DTC are younger
than non-immigrant owners who claim the DTC, in the case of both unincorporated
and incorporated businesses. For instance, 77.1% of immigrant business owners
with disabilities are aged 25 to 64, compared with 46.3% of non-immigrant
business owners with disabilities (Table 3). More than one-half of immigrant
business owners with disabilities are in the 45-to-64 age group.
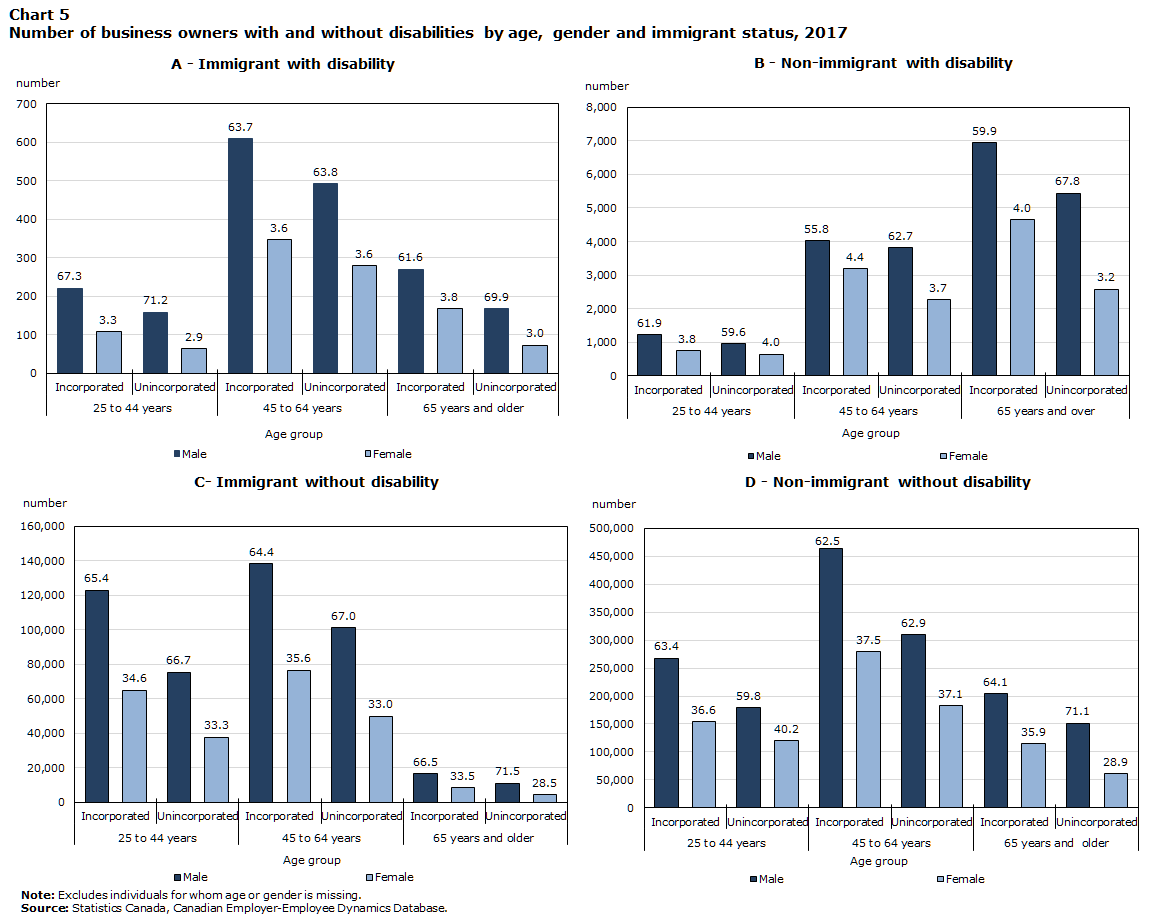
Among immigrant business owners, there is a higher share of
male business owners, regardless of disability. For instance, among the
youngest age category (25 to 44 years), 71.2% of owners of unincorporated
businesses are men (Chart 5A), compared with 59.6% of non-immigrant business
owners (Chart 5B). Moreover, the gender distribution among immigrant business
owners between the age groups (Chart 5A) is similar to that of business owners
without disabilities (Chart 5C).
In terms of the type of business, there are more women
business owners of incorporated businesses than of unincorporated businesses in
the oldest age category, whether the business owners are immigrants or
non-immigrants. For example, 38.4% of immigrant business owners aged 65 and older
of incorporated businesses are women, compared with 30.1% for unincorporated
businesses (Chart 5A). In addition, 40.1% of non-immigrant business owners in
the same age group of incorporated businesses are women, compared with 32.2% for
unincorporated businesses. For how gender and immigrant status intersect when
measured as an ownership share at the firm level, please see the appendix.
The median income of business owners without disabilities is consistently
higher than the median income of those with disabilities
The total personal income of each business owner can also
be found in the T1PMF. The median total personal income of business owners
without disabilities is consistently higher than that of business owners with disabilities
(Table 4), regardless of gender. Moreover, this median income ratio is
generally lower in the 45-to-64 age group. For instance, the median income of
women owners with disabilities is approximately 71.0% to 74.2% of that of women
business owners without disabilities. In contrast, while the median income
ratio is below 1 in the oldest age group (65 years and older), it is higher
than among younger age groups (younger than age 65) and ranges between 88.3%
and 96.1%.
Data table for Chart 5
| With disability | ||||||
|---|---|---|---|---|---|---|
| Age group | Male | Female | Male | Female | ||
| number | ||||||
| Immigrant | 25 to 44 years | Incorporated | 220 | 107 | 67.3 | 3.3 |
| Unincorporated | 158 | 64 | 71.2 | 2.9 | ||
| 45 to 64 years | Incorporated | 609 | 347 | 63.7 | 3.6 | |
| Unincorporated | 492 | 279 | 63.8 | 3.6 | ||
| 65 years and older | Incorporated | 270 | 168 | 61.6 | 3.8 | |
| Unincorporated | 167 | 72 | 69.9 | 3.0 | ||
| Non-immigrant | 25 to 44 years | Incorporated | 1,228 | 755 | 61.9 | 3.8 |
| Unincorporated | 956 | 648 | 59.6 | 4.0 | ||
| 45 to 64 years | Incorporated | 4,034 | 3,192 | 55.8 | 4.4 | |
| Unincorporated | 3,812 | 2,270 | 62.7 | 3.7 | ||
| 65 years and older | Incorporated | 6,942 | 4,649 | 59.9 | 4.0 | |
| Unincorporated | 5,442 | 2,580 | 67.8 | 3.2 | ||
| Without disability | ||||||
|---|---|---|---|---|---|---|
| Age group | Male | Female | Male | Female | ||
| number | ||||||
| Immigrant | 25 to 44 years | Incorporated | 122,730 | 64,875 | 65.4 | 34.6 |
| Unincorporated | 75,218 | 37,589 | 66.7 | 33.3 | ||
| 45 to 64 years | Incorporated | 138,098 | 76,355 | 64.4 | 35.6 | |
| Unincorporated | 101,112 | 49,883 | 67.0 | 33.0 | ||
| 65 years and older | Incorporated | 16,554 | 8,341 | 66.5 | 33.5 | |
| Unincorporated | 10,946 | 4,363 | 71.5 | 28.5 | ||
| Non-immigrant | 25 to 44 years | Incorporated | 267,616 | 154,306 | 63.4 | 36.6 |
| Unincorporated | 179,032 | 120,492 | 59.8 | 40.2 | ||
| 45 to 64 years | Incorporated | 463,793 | 278,808 | 62.5 | 37.5 | |
| Unincorporated | 309,829 | 182,792 | 62.9 | 37.1 | ||
| 65 years and older | Incorporated | 204,466 | 114,568 | 64.1 | 35.9 | |
| Unincorporated | 151,410 | 61,415 | 71.1 | 28.9 | ||
| DTC | non-DTC | DTC/non-DTC | |
|---|---|---|---|
| dollars | median | ||
| Incorporated | |||
| Age group and gender | |||
| 25 to 44 years, female | 44,181 | 54,500 | 0.81 |
| 25 to 44 years, male | 54,306 | 62,848 | 0.86 |
| 45 to 64 years, female | 43,908 | 61,832 | 0.71 |
| 45 to 64 years, male | 51,867 | 72,956 | 0.71 |
| 65 years and older, female | 58,501 | 63,436 | 0.92 |
| 65 years and older, male | 62,583 | 70,860 | 0.88 |
| Unincorporated | |||
| Age group and gender | |||
| 25 to 44 years, female | 25,415 | 36,664 | 0.69 |
| 25 to 44 years, male | 37,897 | 45,781 | 0.83 |
| 45 to 64 years, female | 30,553 | 41,181 | 0.74 |
| 45 to 64 years, male | 34,332 | 46,281 | 0.74 |
| 65 years and older, female | 42,352 | 44,487 | 0.95 |
| 65 years and older, male | 44,710 | 46,534 | 0.96 |
Characteristics of businesses owned by persons with disabilities
As described in the methods section, there are two ways to
identify businesses owned by persons with disabilities: the first is based on
whether a business has one or more owners who claim the DTC, and the second is based
on the shareholders and majority ownership among persons who claim the DTC. When
the former measure is applied, 1.6% of businesses are owned by persons claiming
the DTC. When the latter is used, it is 0.9%. The following sections will focus
on the first measure.Note
This section describes the firm-level characteristics of
the businesses that are owned by persons with disabilities compared with those of
businesses owned by persons without disabilities, aged 25 and older. An
enterprise is included if at least one of the shareholders claimed the DTC.
A slightly higher share of incorporated businesses owned by persons with
disabilities have fewer than one employee compared with businesses owned by
persons without disabilities
Of the total number of businesses, 1.5% of unincorporated
businesses are owned by persons with disabilities, compared with 1.7% of
incorporated businesses. The firm size distribution of businesses owned by
persons with and without disabilities is fairly similar, in that the majority
of incorporated and unincorporated enterprises have fewer than five employees
(Table 5). In unincorporated businesses, 96.8% of businesses owned by a DTC
claimant are in this size category, largely because of the high proportion
(89.0%) of self-employed individuals without paid help. There are more incorporated
businesses in the larger size categories, and these shares are very similar
across businesses owned by persons with and without disabilities. For instance,
9.0% of businesses owned by persons with disabilities have 5 to 20 employees,
compared with 10.4% of businesses owned by persons without disabilities. A
slightly higher share of businesses owned by persons with disabilities (64.6%)
have fewer than one employee compared with businesses owned by persons without
disabilities (58.5%), and this is consistent with evidence in the United
Kingdom that suggests that entrepreneurs with disabilities are more likely to
work alone than employ others (Jones and Latreille 2011).
| With disabilities | Without disabilities | |||
|---|---|---|---|---|
| number | share | number | share | |
| Incorporated | ||||
| Firm size | ||||
| 0 to fewer than 1 | 20,234 | 64.6 | 1,057,086 | 58.5 |
| 1 to fewer than 5 | 7,039 | 22.5 | 492,643 | 27.3 |
| 5 to fewer than 20 | 2,827 | 9.0 | 187,618 | 10.4 |
| 20 to fewer than 100 | 1,073 | 3.4 | 62,043 | 3.4 |
| 100 and over | 135 | 0.4 | 8,271 | 0.5 |
| Total | 31,308 | 100 | 1,807,661 | 100 |
| Unincorporated | ||||
| Firm size | ||||
| fewer than 1 | 15,466 | 89.0 | 1,013,336 | 89.7 |
| 1 to fewer than 5 | 1,363 | 7.8 | 87,610 | 7.8 |
| 5 to fewer than 20 | 471 | 2.7 | 25,323 | 2.2 |
| 20 to fewer than 100 | 61 | 0.4 | 2,697 | 0.2 |
| 100 and over | 24 | 0.1 | 176 | 0.00 |
| Total | 17,385 | 100 | 1,129,142 | 100 |
There are notable differences in the industry distribution of businesses
owned by persons with and without disabilities
The industry distribution of businesses varies across
business types (i.e., unincorporated and incorporated) and between businesses
owned by persons with and without disabilities (Table 6). Among unincorporated
businesses, nearly two-thirds of DTC claimant-owned businesses operate in real
estate and rental and leasing (27.8%); agriculture, forestry, fishing and
hunting (26.6%); and professional, scientific and technical services (10.4%). This
compares with one-half of businesses not owned by DTC claimants. The share of
non-DTC-claimant-owned businesses that operate in construction (10.4%) is
double the share of DTC claimant-owned businesses (5.2%).
DTC claimant-owned incorporated businesses are more likely
to operate in finance and insurance (14.6% compared with 9.4%) and in real
estate and rental and leasing (14.6% compared with 9.9%) than non-DTC-claimant-owned
businesses. In contrast, non-DTC-claimant-owned businesses (16.1%) are more
likely than DTC claimant-owned businesses (12.6%) to operate in professional,
scientific and technical services. Notably, the share of businesses operating
in goods-producing industries is almost identical between DTC claimant-owned
(22.4%) and non-DTC-claimant-owned (22.3%) businesses.
| Unincorporated | Incorporated | |||
|---|---|---|---|---|
| DTC | Non-DTC | DTC | Non-DTC | |
| Industry | share | |||
| Agriculture, forestry, fishing and hunting | 26.6 | 14.5 | 5.8 | 4.2 |
| Mining, quarrying, and oil and gas extraction | 0.2 | 0.2 | 1.2 | 0.9 |
| Utilities | 0.9 | 0.5 | 0.0 | 0.1 |
| Construction | 5.2 | 10.4 | 11.6 | 13.5 |
| Manufacturing | 1.7 | 1.9 | 3.9 | 3.6 |
| Wholesale trade | 1.0 | 1.1 | 4.2 | 4.0 |
| Retail trade | 5.0 | 5.1 | 7.0 | 7.4 |
| Transportation and warehousing | 4.1 | 7.2 | 3.9 | 6.0 |
| Information and cultural industries | 1.1 | 1.5 | 1.0 | 1.5 |
| Finance and insurance | 1.0 | 1.1 | 14.6 | 9.4 |
| Real estate and rental and leasing | 27.8 | 22.0 | 14.6 | 9.9 |
| Professional, scientific and technical services | 10.4 | 13.6 | 12.6 | 16.1 |
| Management of companies and enterprises | 0.1 | 0.1 | 1.9 | 1.7 |
| Administrative and support, waste management and remediation services | 4.1 | 5.3 | 3.7 | 4.1 |
| Educational services | 0.7 | 1.1 | 0.8 | 0.9 |
| Health care and social assistance | 2.5 | 3.8 | 5.3 | 6.8 |
| Arts, entertainment and recreation | 1.8 | 2.7 | 0.9 | 1.1 |
| Accommodation and food services | 1.4 | 1.5 | 3.5 | 4.4 |
| Other services (except public administration) | 4.3 | 6.6 | 3.7 | 4.4 |
In general, financial measures such as revenue and net income tend to be
higher for businesses owned by persons without disabilities
It is also possible to examine differences in financial
characteristics of DTC claimant- and non-DTC-claimant-owned incorporated
businesses, including revenue, assets, R&D expenditures and exports. In
general, financial measures tend to be higher for non-DTC-claimant-owned
businesses than for DTC claimant-owned businesses. Average net income, total
assets and R&D spending are all higher for non-DTC-claimant-owned
businesses, and the difference is statistically significant (Table 7). Average
revenue is also higher for non-DTC-claimant-owned businesses than DTC claimant-owned
businesses, but the difference is not statistically significant. Average
capital cost allowance, which is a proxy for investment, is very similar
between both types of businesses.
In terms of exports, DTC claimant-owned businesses are as
likely as non-DTC-claimant-owned businesses to be exporters. The average value
of exports is slightly higher for non-DTC-claimant-owned businesses.
| Incorporated | p-value | ||
|---|---|---|---|
| DTC claimant | Non-DTC claimant | ||
| dollars | |||
| Measure | |||
| Average revenue | 869,378 | 1,076,641 | 0.000Table 7 Note ‡ |
| Average net income | 108,971 | 161,160 | 0.000Table 7 Note ‡ |
| Average total assets | 2,103,988 | 2,298,397 | 0.777 |
| Average capital cost allowance (investment) | 26,647 | 26,945 | 0.917 |
| Average research and development spending | 1,239 | 1,926 | 0.000Table 7 Note ‡ |
| Exports | |||
| Average exports | 57,015 | 59,153 | 0.9122 |
| Number of exporters (number) | 546 | 28,730 | Note …: not applicable |
| Share that are exporters (percent) | 1.7 | 1.5 | Note …: not applicable |
Conclusion
The literature describes how persons with disabilities face
barriers when it comes to the labour market and business ownership. In Canada,
the lack of frequent and comprehensive data on business ownership among persons
with disabilities presents challenges in providing a full picture of this
group, which in turn is needed to design policies to address barriers to
business ownership. Using the CEEDD, this study attempts to fill this gap by
examining the sociodemographic characteristics of business owners with
disabilities, as well as the firm-level attributes of the businesses they own.
In terms of business ownership among persons with
disabilities, this study finds that 1.3% of individuals who claim the DTC are
shareholders of unincorporated businesses and 1.2% are shareholders of
incorporated businesses. These business owners tend to be older than business
owners who do not claim the DTC, and a slightly higher share tend to be women
compared with those who do not claim the DTC, although business ownership
remains male-dominated. A small proportion of business owners with disabilities
are immigrants.
While the data appear robust compared with other data
sources, this paper finds that about half of business owners with disabilities
are aged 65 and older. As this study uses the DTC, which is more likely to be
claimed by persons aged 65 and older, to identify persons with disabilities, it
may be underrepresenting younger business owners with disabilities. Future work
will use the Census of Population, and specifically the CSD, to capture a
broader sample of the population with disabilities. Nevertheless, this study is
a first step in using administrative data to provide a picture of business
owners with disabilities.
Finally, this study provided a snapshot of the
sociodemographics of business owners with disabilities and the firm-level
characteristics of the businesses they own. It finds similarities in terms of
firm size and financial characteristics compared with businesses owned by
persons without disabilities, but differences in industry distribution. Future
work could explore changes over time, including business growth and dynamics,
and stability of business ownership among business owners with disabilities, and
explore outcomes of businesses broken down further by gender and immigrant
status.
Appendix
Ownership share by different subgroups
The firm-level ownership share was generated for gender and
immigrant status variables where one shareholder has a disability and is aged
25 or older. As is evident from the previous demographic summaries, men have
the majority ownership in unincorporated and incorporated businesses with no
distinction between firms owned by individuals with and without disabilities.
What is notable is that there is a greater share of enterprises with equal
ownership for businesses owned by individuals with disabilities (Appendix Table A.1).
| DTC claimant | Non-DTC claimant | |||
|---|---|---|---|---|
| number | percent | number | percent | |
| Unincorporated | ||||
| Ownership type | ||||
| Equal ownership | 3,274 | 18.80 | 108,762 | 0.10 |
| Majority-owned by male | 9,238 | 53.10 | 694,994 | 0.62 |
| Majority-owned by female | 4,243 | 24.40 | 321,402 | 0.29 |
| Unclassified | 630 | 3.60 | 3,984 | 0.00 |
| Total | 17,385 | 100.00 | 1,129,142 | 1.00 |
| Incorporated | ||||
| Ownership type | ||||
| Equal ownership | 5,874 | 18.80 | 262,105 | 14.50 |
| Majority-owned by male | 15,484 | 49.50 | 1,065,664 | 59.00 |
| Majority-owned by female | 5,516 | 17.60 | 295,392 | 16.30 |
| Unclassified | 4,434 | 14.20 | 184,500 | 10.20 |
| Total | 31,308 | 100.00 | 1,807,661 | 100.00 |
Businesses with a majority
of non-immigrant shareholders capture almost the entire number of enterprises
that have business owners with disabilities (Appendix Table A.2). Although a similar
observation can be made for businesses owned by individuals without disabilities,
the difference is not as pronounced. Across all dimensions, equal ownership has
the fewest businesses.
| DTC claimant | Non-DTC claimant | |||
|---|---|---|---|---|
| number | percent | number | percent | |
| Unincorporated | ||||
| Ownership type | ||||
| Equal ownership | 150 | 0.90 | 9,365 | 0.80 |
| Majority-owned by immigrants | 1,220 | 7.00 | 244,744 | 21.70 |
| Majority-owned by non-immigrants | 16,007 | 92.10 | 874,785 | 77.50 |
| Unclassified | 8 | 0.00 | 248 | 0.00 |
| Total | 17,385 | 100.00 | 1,129,142 | 100.00 |
| Incorporated | ||||
| Ownership type | ||||
| Equal ownership | 370 | 1.20 | 28,238 | 1.60 |
| Majority-owned by immigrants | 1,942 | 6.20 | 345,841 | 19.10 |
| Majority-owned by non-immigrants | 26,863 | 85.80 | 1,290,493 | 71.40 |
| Unclassified | 2,133 | 6.80 | 143,089 | 7.90 |
| Total | 31,308 | 100.00 | 1,807,661 | 100.00 |
Businesses majority-owned by women immigrants represent
1.6% of all unincorporated businesses owned by persons with disabilities and 1.1%
of all incorporated businesses owned by persons with disabilities (Appendix Table A.3).
| DTC claimant | Non-DTC claimant | |
|---|---|---|
| Unincorporated | ||
| Female | 277 | 63,322 |
| Male | 688 | 161,404 |
| Incorporated | ||
| Female | 351 | 68,042 |
| Male | 1,112 | 222,915 |
References
Arim, R. 2015. A Profile of Persons with Disabilities Among
Canadians Aged 15 Years or Older, 2012. Canadian Survey on Disability.
Statistics Canada Catalogue no. 89-654-X. Ottawa: Statistics Canada.
Boylan, A., and T. Burchardt. 2002. Barriers to
Self-Employment for Disabled People. Report prepared for the Small Business
Service. London: Small Business Service.
Chan, P.C.W., H. Liu, and R. Morissette. 2018. Canadian
Employer-Employee Dynamics Database (CEEDD) User Guide – Overview. Ottawa: Statistics
Canada.
Duclos, É., and R. Langlois. 2003. Disability Supports
in Canada, 2001. Participation and Activity Limitation Survey. Statistics
Canada Catalogue no. 89-580-X. Ottawa: Statistics Canada.
Dunstan, T. 2003. Lower Rates of Self-Reported
Disability in Quebec than the Rest of Canada: An Investigation Into Some of the
Factors. PALS Data Interpretation Workshop. Ottawa: Statistics Canada.
Grekou, D., W. Gu, and B. Yan. 2020. Decomposing the
Between-firm Employment Earnings Dispersion in the Canadian Business Sector:
The Role of Firm Characteristics. Analytical Studies Branch Research Paper
Series, no. 443. Statistics Canada Catalogue no. 11F0019M. Ottawa: Statistics
Canada.
Grekou, D., J. Li, and H. Liu. 2018. The Measurement of
Business Ownership by Gender in the Canadian Employer-Employee Dynamics
Database. Analytical Studies: Methods and References, no. 017. Statistics
Canada Catalogue no. 11-633-X. Ottawa: Statistics Canada.
Huang, L. 2020. SME Profile Ownership Demographics
Statistics. Innovation, Science and Economic Development Canada Catalogue
no. u188-113. Ottawa: Innovation, Science and Economic Development Canada.
Jones, M. 2011. “Disability, employment and earnings: an
examination of heterogeneity.” Applied Economics, 43(4), 1001-1017.
Jones, M., and P. Latreille. 2011. “Disability and self-employment:
Evidence for the UK.” Applied Economics 43 (27): 4161–4178.
Kitching, J. 2014. Entrepreneurship and Self-employment
by People with Disabilities. Background paper for the Organisation for
Economic Co-operation and Development (OECD) Project on Inclusive
Entrepreneurship. Paris: OECD Publishing.
Lechner, M., and R. Vazquez-Alvarez. 2003. The Effect of
Disability on Labour Market Outcomes in Germany: Evidence from Matching.
IZA Discussion Paper no. 967. Bonn: IZA Institute of Labor Economics.
Mackenzie, A. 2013. Divergent Disability Rates in
Canada: Analysis of the Social Determinants of Disability. Doctoral thesis.
Ottawa: Carleton University.
Morris, S., G. Fawcett, L. Brisebois, and J. Hughes. 2018. A
Demographic, Employment and Income Profile of Canadian with Disabilities Aged
15 Years and Over, 2017. Statistics Canada Catalogue no. 89-654-X. Ottawa:
Statistics Canada.
Renko, M., S.P. Harris, and K. Caldwell. 2015. “Entrepreneurial
entry by people with disabilities.” International Small Business Journal 34 (5): 555–578.
Statistics Canada. 2020. Canadian Survey on Disability,
2017. (accessed October 26, 2021).
Wall, K. 2017. Low Income Among Persons with a
Disability in Canada. Insights on Canadian Society. Statistics Canada
Catalogue no. 75-006-X. Ottawa: Statistics Canada.